

14 min read
7 Social Media Metrics That You Should Start Tracking Right Now

12 min read
This blog post was originally contributed by Erin Peacock from EVO Payments, Inc.
Measuring social media metrics is not always easy. Social media is incredibly fast, dynamic, and constantly evolving. Analyzing success across multiple social networks, platforms, and communities can be daunting especially when you are paying attention to many different conversations at once.
Where do you begin to quantify results as an online retailer?
How do you know your eCommerce website and landing pages are performing well?
How do you know you are making an impact on your target audience and reaching your goals?
As if managing a social media strategy wasn’t hard enough, gauging results poses its own unique challenges. How do you measure social media results that have an impact on your bottom line? You need a clear strategy to analyze your success. That’s where social media metrics can save the day.
What Are Social Media Metrics?
The proof is in the pudding, numbers don’t lie, and accurate data is critical to interpreting success on social media. Media metrics are the important data points online retailers can use to analyze the success of their social strategy. Collectively, media performance metrics can help influence and define future campaign tactics, improve engagement rates and click-through rates, help to increase conversion rates, and bring brand awareness.
For more ways to increase your conversion rates with social media check out this article by Payability.
It’s an integral part of your social strategy to produce engaging content, interact with your audience, and gain valuable feedback when it comes to your products and services. By using data, you can see the impact of these products and services to your customers and fine-tune your strategy quickly as the platforms continue to evolve and release new features and algorithms.
Many online retailers monitor click-through rates, shares, and comments. In a social media campaign, it is also important to understand engagement and frequency. In this article, we’ll highlight some of the most important social media success metrics you should be tracking over the course of your campaigns and how to go about measuring them.
Here are top social media metrics to track:
- Engagement
- Reach
- Amplification
- Referrals
- Bounce Rate
- Click-Through-Rate (CTR)
- ROI
Let’s learn about each of the social media metrics that matter.
1. Engagement Rate
Social engagement is the process of communicating in an online community or platform. Engagement happens on Facebook, Twitter, LinkedIn, Instagram and even blogs. This should always be the main part of your social strategy as engaging consumers in social conversations is the best way to increase brand awareness.
Why should you care about Engagement Rate?
Measuring social media engagement is vital. As a brand on social media, you must be accessible and approachable. A study by Bain & Company suggests that when companies engage and respond to customer service requests over social media, those customers, on average, end up spending 20- 40% more with the company.
It’s clear that engagement drives conversion rates.
Do your posts have a strong call to action? Are your social posts reaching impactful and influential people? Using a tool like Trustpilot may help you engage with customers.
According to a Buffer study, the best time to post to Facebook is between 1 p.m. – 3 p.m. during the week and on Saturdays. Engagement rates are 18% higher on Thursdays and Fridays than any other day.
Just because someone has a large following doesn’t necessarily mean they are influential.
Studies show that the average engagement rate on Instagram increases as the number of followers decreases. It was proven that micro-influencers with less than 35K subscribers demonstrate a staggering 5.3% engagement rate. And the more followers they get, the lower their engagement rate becomes.
If we take a look at the influencers with 750K followers or more, we’ll notice that their engagement rate is only 1.6% .
How do you measure Engagement?
How do you know if you are creating engaging content? All individual social media platforms will report that specific metric on any ads you are running. You can determine the engagement rate for your account by running multiple ads to find an average rate. If an ad gets below your average, it’s probably a good idea to make some changes or stop running it.
Facebook and Instagram allow you to check your engagement metric, here’s how:
- Open Facebook Page
- Select Insights
- Select Post
- Engagement metrics will be displayed.

2. Reach
Reach is the number of people your product, brand or service is being seen by. Reach is a visibility percentage — the number of views your content receives.
Social media Reach definition by Facebook defines post Reach as the number of people who had any of your page’s posts on their screen. This number is just an estimate, but it offers insight on the rate of views by your audience.
Why should you measure Reach?
Social Reach is critical to brand awareness and increased growth. As a retailer, growing your social Reach will ultimately help you thrive through visibility. When targeting ads, it’s important to select a broad reach and cast a wide net for maximum visibility. On Facebook and Instagram, posts with more thoughtful and active interactions, get more reach.
How do you measure reach?
So how to calculate the reach social media get? Just like with engagement, reach is available in Facebook Page Insights. Here’s how to track it:
1. Open Facebook Page
2. Select “Insights”
3. Select “Post”
4. Reach metrics will be displayed for each post.

Reach can help you calculate engagement. Divide Reach by the number of clicks, replies, or shares, and you’ll get your engagement metric.
3. Amplification
Amplification is an important social metric because it can really give you an idea of your content’s impact. It’s the ratio of shares per post to your audience size or number of followers.
Why should you measure Amplification?

Amplification is the brainchild of Avinash Kaushik, Digital Marketing Evangelist at Google. He defines Amplification as “the rate at which your followers take your content and share it through their networks.”
Amplification paints a wonderful picture of how much value your content has in your network. If you post something of relevance and high-value, that content will be shared by your network exponentially.
How do you measure Amplification?
Calculating the Amplification metric is fairly straightforward. To measure it you’ll want to find the rate at which your followers consume your content and share it with their networks.
On Facebook, Amplification = Number of Shares Per Post
On a blog or YouTube Amplification = # of Share Clicks Per Post or Video
On Twitter, Amplification = Number of Retweets per Post

4. Social Referrals
Referrals are a very important metric to track as an online retailer. Ultimately, they have a direct impact on your sales. Referrals are defined by the number of visitors that go to your website from social media.
Whenever someone clicks on a social media post and arrives at your website, that’s a direct referral visit.
If your social media strategy is on top of its game, referrals will account for a significant portion of your overall web traffic.
Why should you measure them?
According to WhitePaper, “84% of consumers say they either completely or somewhat trust recommendations from family, colleagues, and friends about products — making these recommendations the information source ranked highest for trustworthiness.”
Hubspot believes that consumers are using social content to determine product trust. They report that. “Consumers are 71% more likely to make a purchase based on social media referrals.”
Driving customers to your website with relevant social media should be one of your primary goals. Referrals also give you an idea of what posts really inspired actionable results.
How do you track social referrals?
Referrals are best monitored through Google Analytics, metric tracking system.
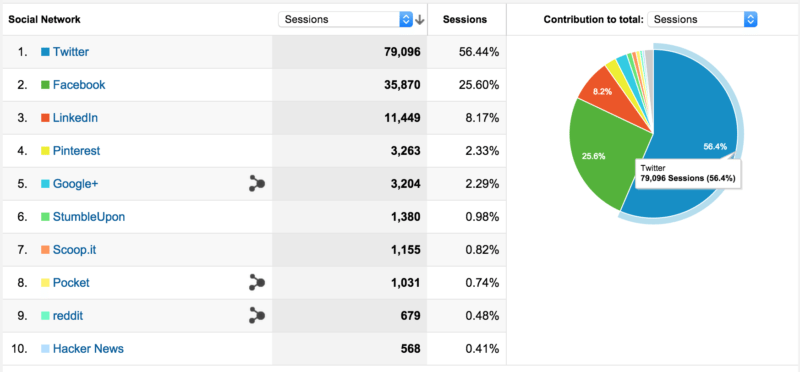
Open Analytics and go to “Acquisition”, select “Social” and then “Network Referrals”. You will see a social media metrics report that defines which social networks are sending the most traffic to your website.
Clicking on each social network name will give you a breakdown of all the links and content that have been shared on that network. You can also get an idea of how much social media impacts all visits to your website by again selecting “Acquisition”, then “All Traffic”, then “Channels”.
The social referral metric will be presented as an overall total across all networks for a higher-level view.
5. Bounce rate
The social media bounce rate is another clever metric available in Google Analytics.
According to Wikipedia, it represents the percentage of visitors who enter the site and then leave (“bounce”) rather than continuing to view other pages within the same site.
Why should you measure bounce?
Bounce rates tend to be high. Morra Aarons-Mele, in a Mashable article on bounce rate metrics, says: “An average bounce rate is about 50%.”
Aarons-Mele encourages retailers to “use social media content to engage people, and keep them informed and entertained.” But when you really need to reach them — use email and social media.
This way, you can get your content out to people without having to rely on them coming to your site of their own volition, and probably ‘bouncing’ off. Taking into a holistic context with Engagement and Reach, it’s important to measure social bounce rate to understand what, if any, of your social content is keeping visitors on your site.
How do you track bounce rates?
Bounce rate metrics are calculated in a simple equation:
The number of visitors who bounce off of a website after visiting a page, divided by the total number of visitors to your website.
As an example, if 70 visitors come to the site from social content and leave without traveling anywhere, and you’ve had a total of 200 visitors, your bounce rate would be 35%.
Bounce rates can be found in Google Analytics:
- Select “Acquisition”, then “All Traffic” and then “All Channels”.
- Then select “Comparison” on the bottom on the right.
- Filter by “Bounce Rate” to see which social channels are above or below your average bounce rate.
- You can also go to “Acquisition” then select “Source/Medium” to see an overall view of bounce rates across social networks.

For a more comprehensive look at real-time site data, Chartbeat, can help you get a handle on your digital marketing as well as how visitors are engaging with your website and its Offsite Social feature can tell you what social content is the most engaging.
6. Click-Through-Rate
Click-Through-Rate or CTR is the social metric that shows how many people click on your social content and arrive at the landing page on your website. As a retailer running paid social campaigns, you’ll want to ensure that your ads point to relevant landing pages to increase conversion.
Why should you measure CTR?
As an eCommerce retailer, monitoring your CTR is imperative. CTR is a metric tied directly to your overall content strategy. If your content is engaging, relevant, and of high-value, your Click-Through-Rate will be high and, ultimately, so will your conversion.
If you are running paid social campaigns, social ads with higher CTR tend to get more impressions and better placement across networks and at a lower cost per click. It can pay-off to get a handle on your CTR and work to create high-value content.
How do you measure CTR?
The equation for calculating Click-Through-Rate is the number of total clicks, divided by the number of total impressions, multiplied by 100.

All social networks will display CTR in your advertising platform.
On Facebook and Instagram, select “Ads” and then “Performance and Clicks.” You can also open Page Insights and select “Promotions” then view “Results from Ads”. Number of Clicks will be displayed along with number of people reached (impressions).
In the example here, the ad received 3 clicks out of 182 impressions, the CTR would be 1.65%.
7. ROI
Another important social media metric is a return on investment or ROI.
Return on investment is a performance metric used to determine the success of social media marketing/advertising. ROI measures the amount of return on investment costs.
Why should you measure it?
Tracking ROI on social media is essential to understand your overall marketing spend and success. In terms of strategy, it also shows you what is and isn’t working well. When measuring return on investment, you want to have clear goals and objectives in mind.
How do you want your brand to be portrayed? What are the steps you are going to take from a content and social media strategy to get there? Are the tactics you are using leading to user engagement, and ultimately sales? The amount of money spent on social media should be within the budget set and allow you to be profitable.
How do you measure ROI?
There are a few different ways to calculate social media marketing ROI. The primary equation is used to understand high-level marketing impact and it is relatively straightforward:
Sales Growth – Marketing Cost) / Marketing Cost = Marketing ROI
This equation doesn’t take into account organic sales, so online retailers may want to also use an additional calculation as well, this gives a more comprehensive view of marketing impact and ROI:
Sales Growth – Organic Sales Growth – Marketing Cost) / Marketing Cost = Marketing ROI
Need an extra hand improving your social strategy and calculating ROI?
There are many tools available that can help you fine-tune your marketing strategy and assist you with tracking social media activity. Hootsuite also offers a great social ROI calculator that is free to use.
Social Media Metrics Shouldn’t Be Scary
While it’s easy to get overwhelmed by tracking so much data over multiple networks, as long as you keep these important metrics in mind, you should have a holistic, qualitative picture of your social media efforts. These metrics shouldn’t scare you away, but rather help you finesse and fine-tune your overall strategy so that you are continually poised for success.
Chapters
- 1. Social Media Listening
- 2. Social Media Metrics
- 3. Social Media Resources
- 4. Social Media Statistics
- 5. Social Media Strategies
- 6. Social Media SEO
- 7. How to Block on Social Media
- 8. How to Create a Social Media Calendar
- 9. The Best Time to Post on Social Media
- 10. How To Change Your Social Media URLs
About the author

Maria
Contributor
Maria is a marketing manager who discovered her passion for digital and content marketing during her student years — and has been immersed in it ever since.


Subscribe to Our Newsletter
to Get Expert-Backed Tips Straight Into Your Inbox


